
This article goes over the steps that I followed for data/documents collection to build a classifier for my client using the Kofax Transformation Module and the importance of choosing the correct sampling strategy, in this case, stratified sampling. My client receives 18 million documents a year, which was a combination of paper and email.
What is a representative set
The sample documents that you collect for the cognitive capture project are called a representative set. The representative set is exactly as the name suggests; It is a set of documents with the same quality, size, markups, frequency, good quality, bad quality, unreadable, handwriting, machine printed text, etc., one expects to see in the real world. Therefore, if you collect your representative set methodically, the benchmark result you see on your representative set should match the result in production plus/minus the margin of error.
Identify the source of data
The very first problem to solve was where to get the data. We were lucky enough that all the paper/emails were already stored in a document management system. So, we had to ask our colleagues to provide a data extract for us.
If you are onboarding a client who doesn’t yet store their documents in an ECM or DMS, you have no choice but to get a copy of email archives or scan incoming/archived papers yourself to multipage tiffs with 300 DPI and group 4 compression.
Define the timeframe
The second problem was how many days of data should we include in our data set and from which weeks/months? We had to make sure that we account for seasonality. If different forms and documents are received at other times of the year, we included them. In my case, the client provided two distinct timeframes. One was around June and the other around December, with a total number of 21 days.
Decide the number of documents
Once we received the data, we realized we had over 1.3 million documents in our extract. So the next problem was how many documents do we need to include in our representative set. And to answer that, you have to ask yourself and your client what margin of error is acceptable for them. The margin of error formula for 95% confidence is the following:

To minimize the margin of error and yet have a reasonable elapsed time for classification and separation benchmarking, we decided to go with a 10,000 sample size. Therefore, according to the margin of error formula, we can predict with 95% confidence that the result that we see in our benchmark will be plus/minus 1%
Choose a sampling strategy
Now to the biggest problem. How do we sample 10,000 from 1,300,0000 documents. We had three strategies to choose from simple random sampling, reservoir sampling and stratified sampling.
We were looking to have four classes in total. However, 65% of the volume belonged to one class. Therefore, simple and reservoir sampling was too risky. Both techniques could lead to undersampling or oversampling of specific classes. Our best bet was to utilize stratified sampling. We had to break down the 1.3 million document into smaller subpopulations and samples from each subpopulation.
To create our subpopulations, we decided to OCR all the documents’ footers and headers and organize them into folders based on the values read from the form. So each folder became a sub-population.
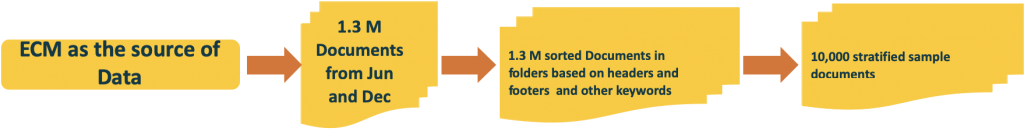
The picture below summarizes our steps for creating the representative set.
Label the data
We received the class label for the documents as part of the ECM extract. However, we still had to make sure that the data was completely accurate. So we asked the document expert users to verify the documents and the assigned classes by moving the documents to various folders in windows file explorer. Each folder represented a class.
Build the model
During this phase, we built four different models, and each of them would improve the results in some aspects and completely regress in other areas. The team’s morale was so low that the consensus was to move on to the next phase without completing this phase. Before we threw the towel, we aggregated our learning from each failed model and made a brand new hypothesis. In a machine learning project, the data is the king, and it dictates your direction. We started building the new model, and we immediately knew that we are onto something this time.
Results; Expectaion vs Reality
Here is the breakdown of the old model vs the new model’s expected performance (benchmark results we estimated during development) vs the new model’s actual result (Reported by KAFC). The chart shows what percentage of documents for a given class is automatically classified and separated by the AI. (The results are actual, but I changed the class names to protect my client’s identity)
Conclusion
We increased the overall recall from 38% to 89% while maintaining a slightly better accuracy. It means that an additional 10.5 million documents do not need to be reviewed by a human operator anymore. I credit the achievement to my team’s hard work and also using a meticulous approach for collecting the representative set.