
This article aims to dive a little deeper into how to measure productivity in an IDP solution. The principles introduced here are generic and can be applied to any system. However, we use a Kofax/KTM platform to provide specific examples.
If you haven’t read the introductory post about the framework, I strongly recommend reviewing it before reading this post.
A typical IDP workflow
We already discussed what an IDP solution is trying to solve. It’s a workflow of attended modules and unattended services that enables processing documents. The flow below depicts a typical workflow:
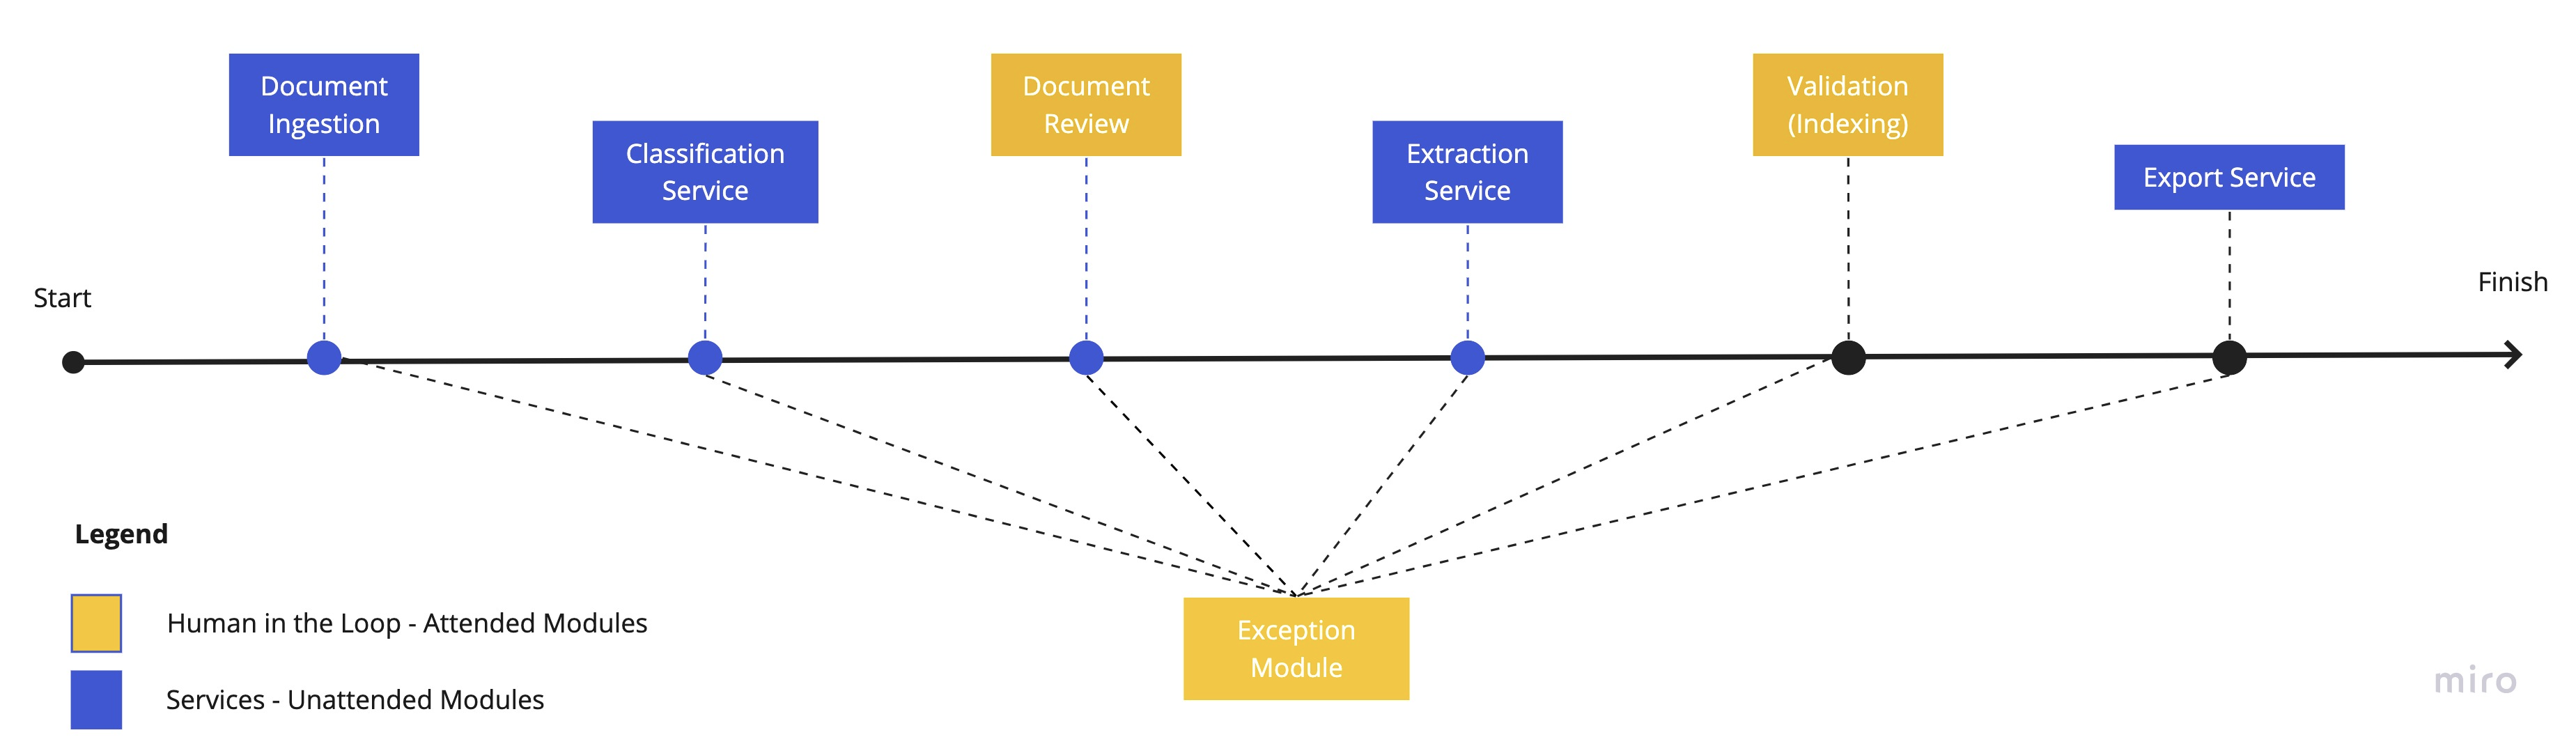
Document Ingestion
Documents, in the form of the email body, email attachments, scanned paper, faxes, file imports, etc., are ingested and imported into the system and kickstart the workflow.
Classifiaction Service
A classifier runs a pre-trained model on documents in this service to predict whether a document belongs to pre-defined buckets. A real example would be classifying documents received in a mailbox to correspondents, application forms, supporting documents, etc.
If documents were scanned as paper, an additional classifier is run to determine the start and end of a document. The process of determining the start and end of a document is called separation.
Document Review
When the classifier is not confident about a document, it will flag it and send it to document review for a human to review the results. Humans can change classes, merge, split or even delete documents and pages in this module.
Extraction Service
The next step in a typical flow is the extraction service. Any AI, algorithm, formatters, validation rule or custom logic is executed as part of this service to extract values for your predefined fields.
Validation
If a document contains a field that the system was not confident about its value, it will route the document to the Validation module for human review. Humans will review all the unconfident fields and either confirm a value extracted by the system or retype the correct value.
Export
The last step is to hand over the document and its associated metadata to a downstream system/s performed by the Export service.
Quality Control
Documents can end up in this module either by the automatic rejection of unattended services or by a human in one of the attended modules. Either way, the sheer routing of a document to this module means something has gone wrong and needs further review and action by a human.
A senior resource usually works in this module to resolve the exceptions.
What values to collect
If you remember from the previous article, the KPI we are interested in is how long it takes to process one document per second of human labour before and after implementing an IDP solution.
Number of Documents
This is the number of documents that went through the export service successfully in a specific time frame.
Cumulative seconds of human labour
This number is the total seconds all the operators spent processing documents in attended modules in a specific time frame. Please note that unattended services must be excluded from this calculation.
The Query
Here is a query you can run against Kofax Analytics for Capture Database. Of course, the idea behind the query applies to other IDP platforms as well.
Select distinct BatchExports.ExportDate
,BatchExports.BatchClassName
,BatchExports.CtExpDoc ExportDocCt
,TotProcSec TotProcSec

from

(SELECT distinct dateadd(day,datediff(day,0,SessionEndTime),0) ExportDate
,BatchClassName
,sum(DocumentCount) CtExpDoc

from

[KAFC_Data].[dbo].[LastVersionOfBatch]
where ModuleName='Export' and [State]='Released'
and SessionEndTime>'2021-01-01' and SessionEndTime<'2021-08-01'
and BatchClassName in ('My BatchClass')
group by  dateadd(day,datediff(day,0,SessionEndTime),0) ,BatchClassName) BatchExports

inner join

(select distinct dateadd(day,datediff(day,0,SessionEndTime),0) ProcessDate
,BatchClassName
,sum(DocumentCount) DocCt
,sum(ProcessingSeconds) TotProcSec

from

[KAFC_Data].[dbo].[HistoryOfBatch]
where Operator not in ('Service Accounts/Admin Accounts')
and ModuleName in (/*'Batch Manager',*/'KTM Document Review','KTM Validation','KTM Validation 2'/*,'KTM Validation 3'*/,'Quality Control')
and SessionEndTime>'2021-01-01' and SessionEndTime<'2021-08-01'
group by dateadd(day,datediff(day,0,SessionEndTime),0),BatchClassName/*,Operator,BatchGuid,DocumentCount,[PageCount],ModuleName*/
) People
on BatchExports.ExportDate=People.ProcessDate and BatchExports.BatchClassName=People.BatchClassName


order by BatchExports.ExportDate,BatchExports.BatchClassName
Result Set
Here is the result you would expect from the above query. The data here is manufactured for demonstration purposes.
| Export Date | Batch Class Name | Export Doc Count | Total Processing Time in Seconds |
| 2020-11-02 | Batch Class A | 6850 | 169510 |
| 2020-11-02 | Batch Class B | 3231 | 23108 |
| 2020-11-03 | Batch Class A | 6986 | 208207 |
| 2020-11-03 | Batch Class B | 208207 | 55254 |
Pivot table
The last step is pretty trivial, but I will share the steps just in case.
First, create a custom field, call it total seconds per document and use “=TotProcSec/ExportDocCt” in the formula.
Next, use the following pivot table setting :
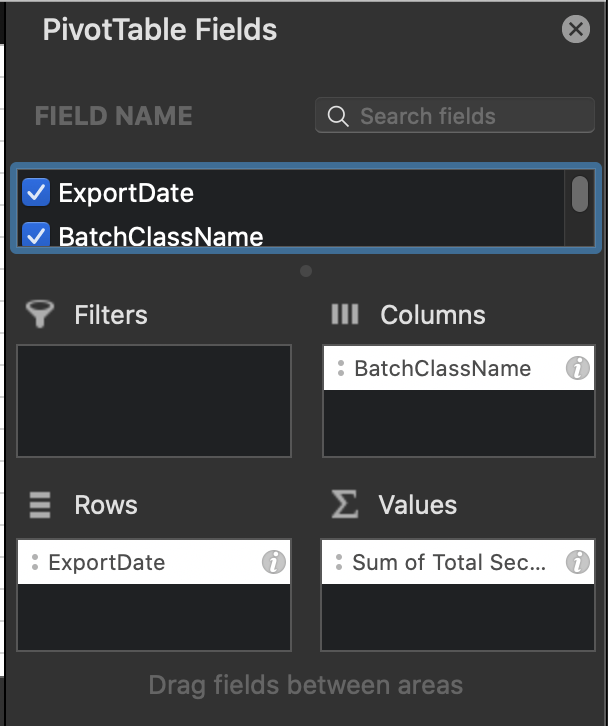
You would see a result similar to this:
| Row Labels | Batch Class A | Batch Class B | Grand Total |
| 2020-11-02 | 24.75 | 7.15 | 19.11 |
| 2020-11-02 | 29.80 | 5.24 | 15..03 |
| Grand Total | 27.30 | 5.69 | 16.52 |
The magic number we are looking for here is 16.52 seconds. This means that, on average, it takes 16.52 seconds to process one document in this system. Therefore, to compare an old solution to a newer one, you would need to repeat this process for both systems and make a comparison to calculate the improvement.
Productivity by Module
Another interesting and useful view for productivity is breaking it down by module.
The query
Here is the query for getting the data for each attended module:
Select *
from
(select distinct dateadd(day,datediff(day,0,SessionEndTime),0) ProcessDate
,BatchClassName
,ModuleName
,sum(DocumentCount) DocCt
,sum(ProcessingSeconds) TotProcSec
FROM [KAFC_Data].[dbo].[HistoryOfBatch]
where Operator not in ('Service Accounts/Admin Accounts')
and ModuleName in (/*'Batch Manager',*/'KTM Document Review','KTM Validation','KTM Validation 2'/*,'KTM Validation 3'*/,'Quality Control')
and SessionEndTime>'2020-11-01' and SessionEndTime<'2021-03-06'
group by dateadd(day,datediff(day,0,SessionEndTime),0),BatchClassName,ModuleName/*,DocumentCount,*/
) People
order by 1,2,3
When you create the pivot table, divide the average seconds a document spent in each module by the number of exported documents in the same period of time. The result would be similar to the overall productivity report with the addition of the breakdown per module.
The module productivity report is super insightful and can be extremely useful in showing which module is the bottleneck in the workflow, and which leg of your project had the highest ROI. In addition, it tells the complete story of your labour and where they are spending their time.